Data Profile Page Redesign
FiscalNote supports organizations to monitor, manage, and act on the issues that are important to them by combining policy and stakeholder data with AI technology and expert analysis.
This project improved policy and stakeholder tracking, usability, and business impact across government affairs teams.
Role
Lead Product Designer
Projected Business Impact
Increase ARR by 40%
Project Overview
Problem & Technical Challenges
- Stakeholder and policy information scattered across 5+ different platforms and tools.
- No centralized view of communication history or engagement patterns.
- Limited visibility into stakeholder influence levels and project impact.
- Inconsistent relationship management across different project teams.
- Usability Studies and User Interviews reported:
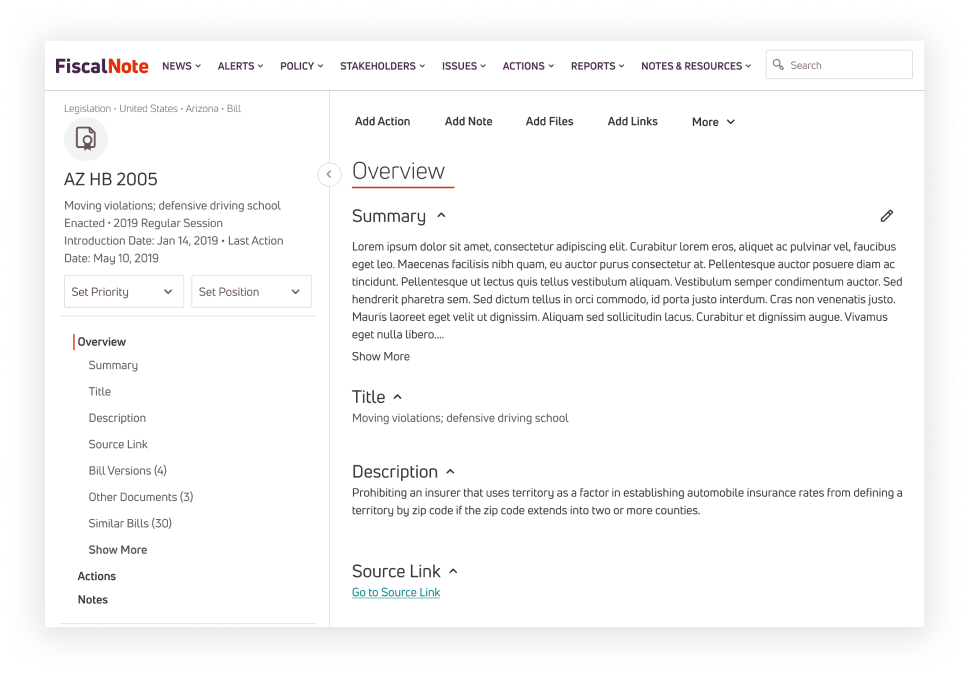
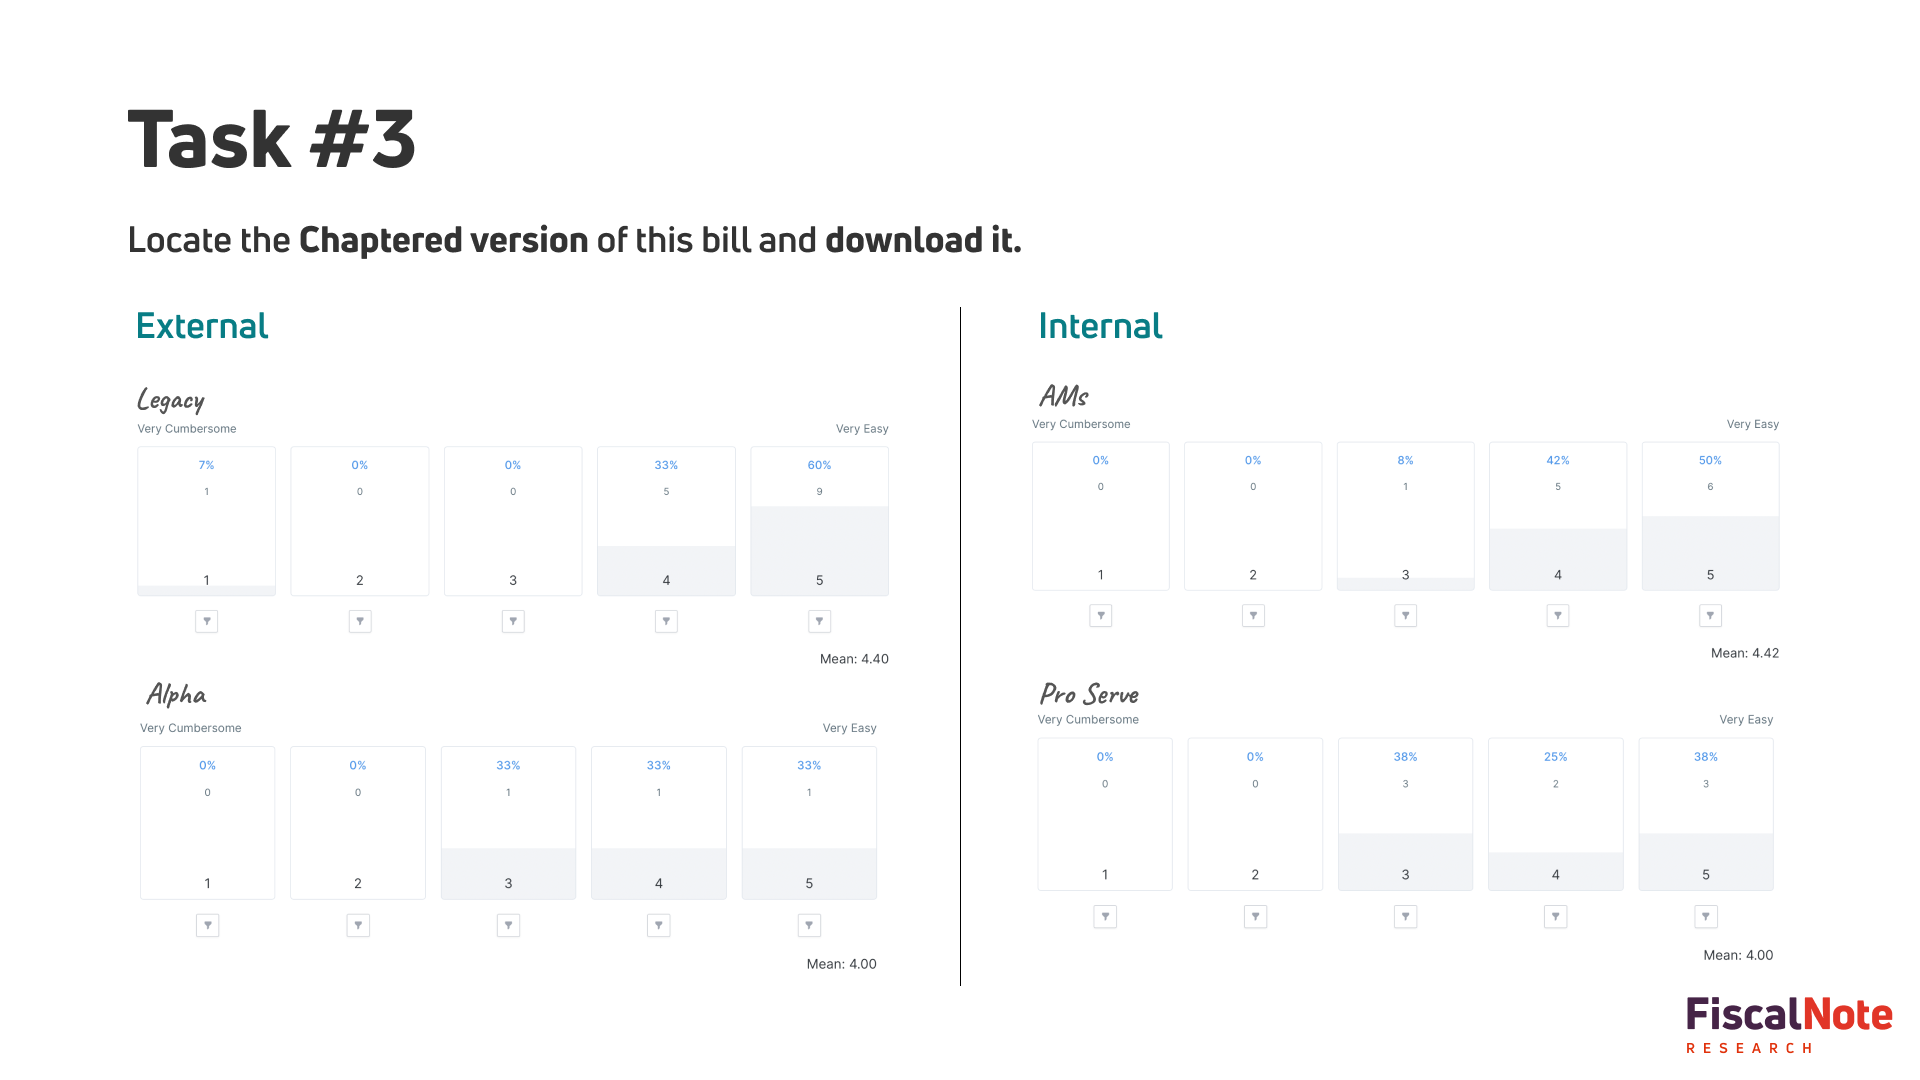
- Difficulty locating bill summaries (in different places and it wasn’t obvious it was user generated).
- Information layout was overwhelming and unable to locate specific details.
Business Goals
- Make stakeholder management more intuitive.
- Improve task completion speed and accuracy.
- Support account retention and ARR expansion.
- Reduce cognitive load and feature confusion.
Solutions
- Simplified Search UI
- Refined layout with clearer hierarchy
- Consolidated filters and added advanced tag logic
- Result Cards
- Redesigned to surface the most relevant metadata (job title, region, last engagement)
- Enabled sorting by engagement recency
- System Components
- Built 40+ reusable components to scale across FiscalNote products
- Ensured accessibility, responsiveness, and faster developer adoption
Projected Business Impact and Results
ARR and retention improvements modeled based on usage correlation over 6 months and feedback from Customer Success.
+16%
SUS Score
Improved usability score from 74.5 to 86.4 through better workflows.
30+
Reusable Components
New reusable UI elements and updated data information architecture added to design system across the platform.
-25%
Design Time
Reduced design workflows by 25% for faster delivery through reusable layouts and component patterns.
-30%
Dev Time Saved
Cut implementation time by 30% via tighter design-dev handoff using Figma tokens.
+$420K
ARR Influence
Attributed to feature adoption and improved stakeholder tracking ROI.
-12%
Churn
Drop in churn among Government Affairs users due to workflow clarity.
Information Architecture & Components
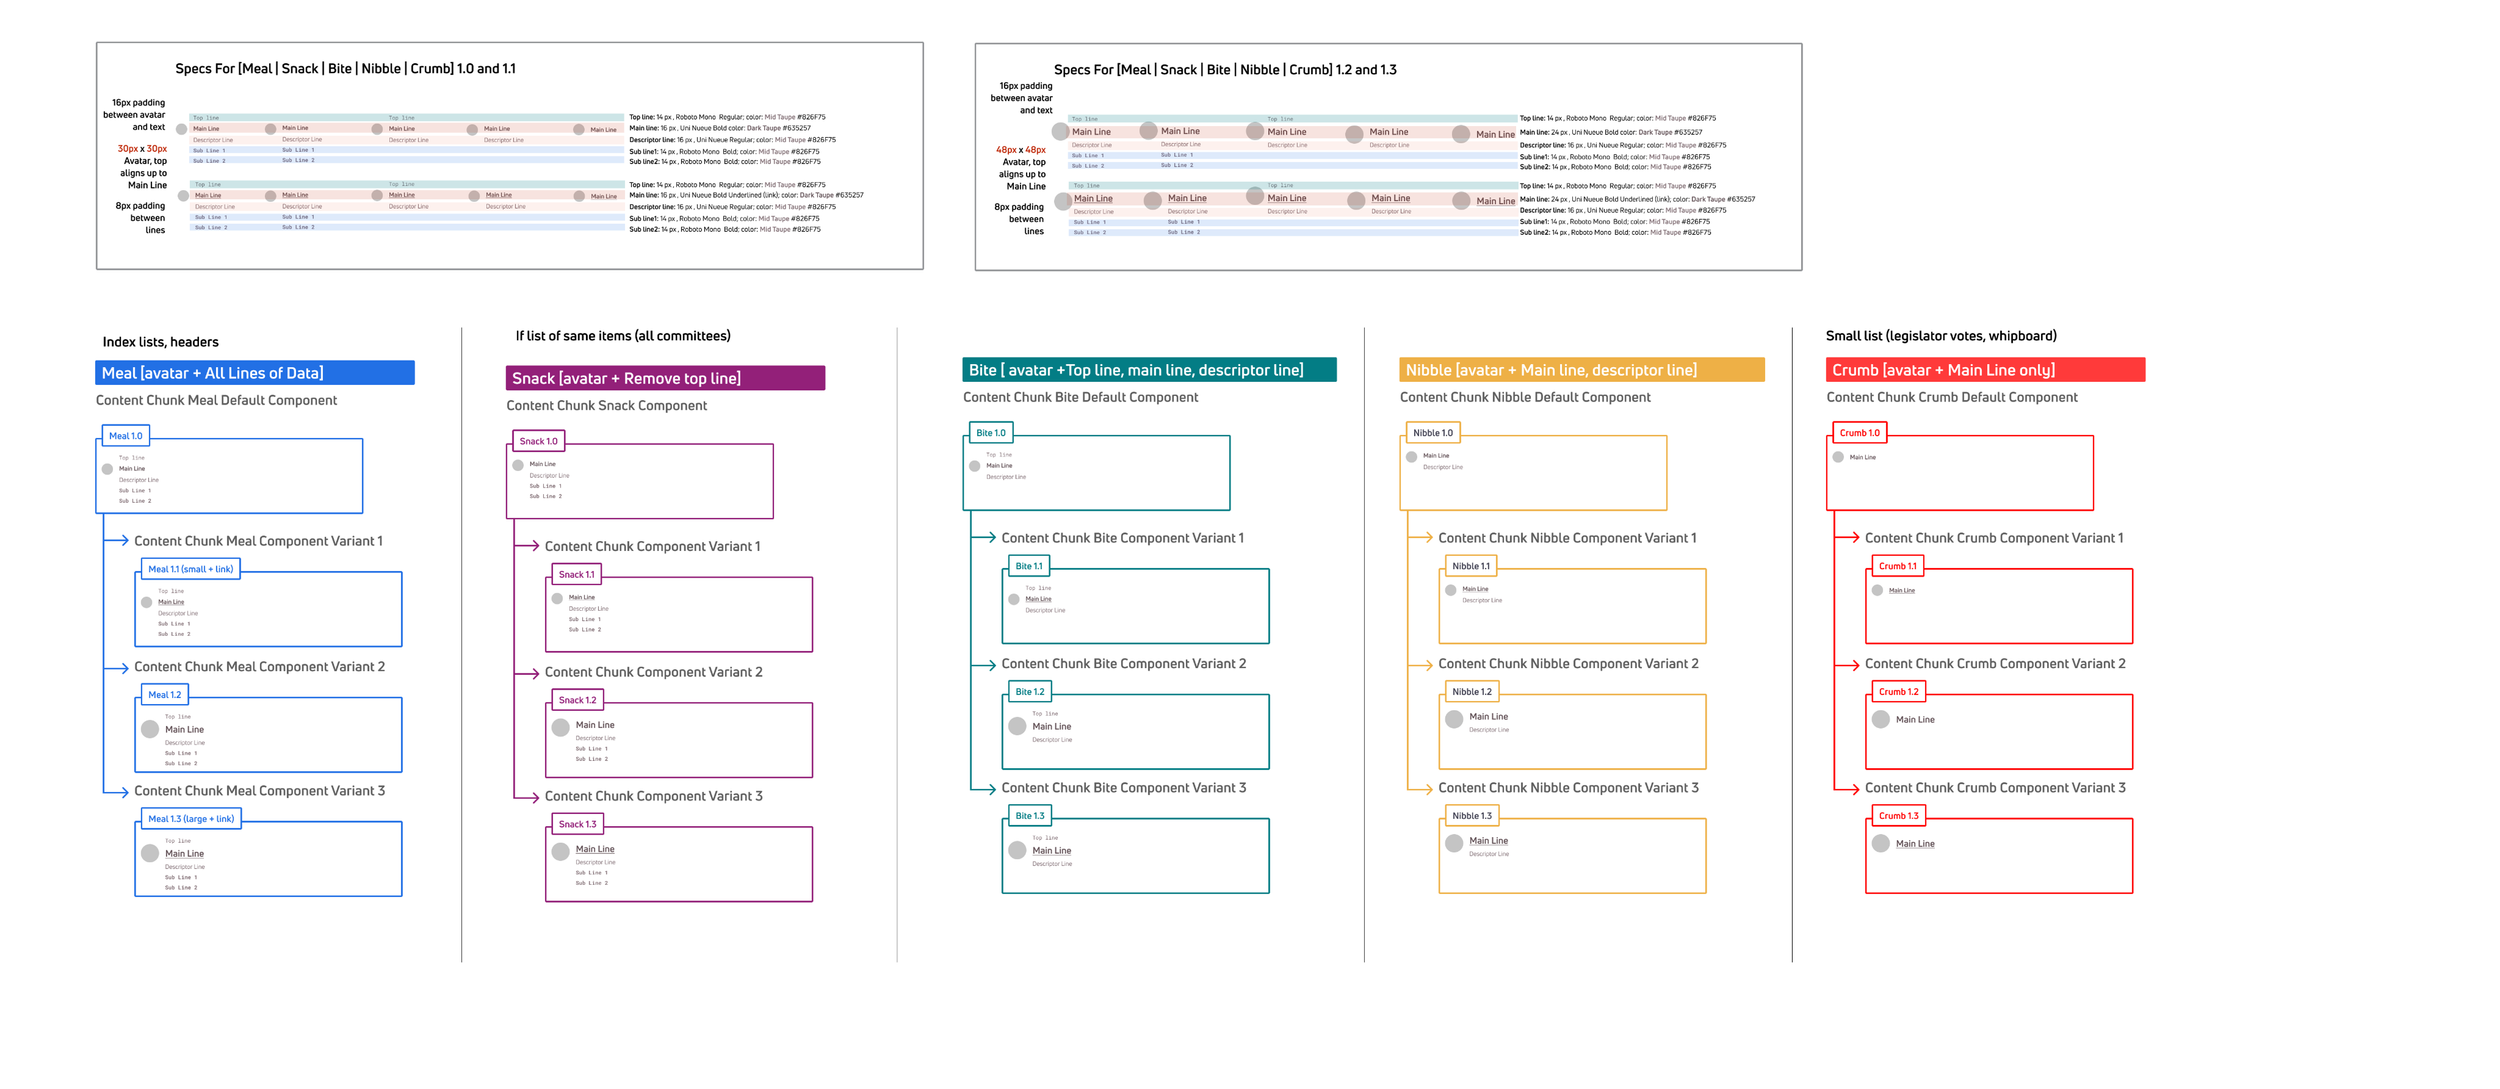
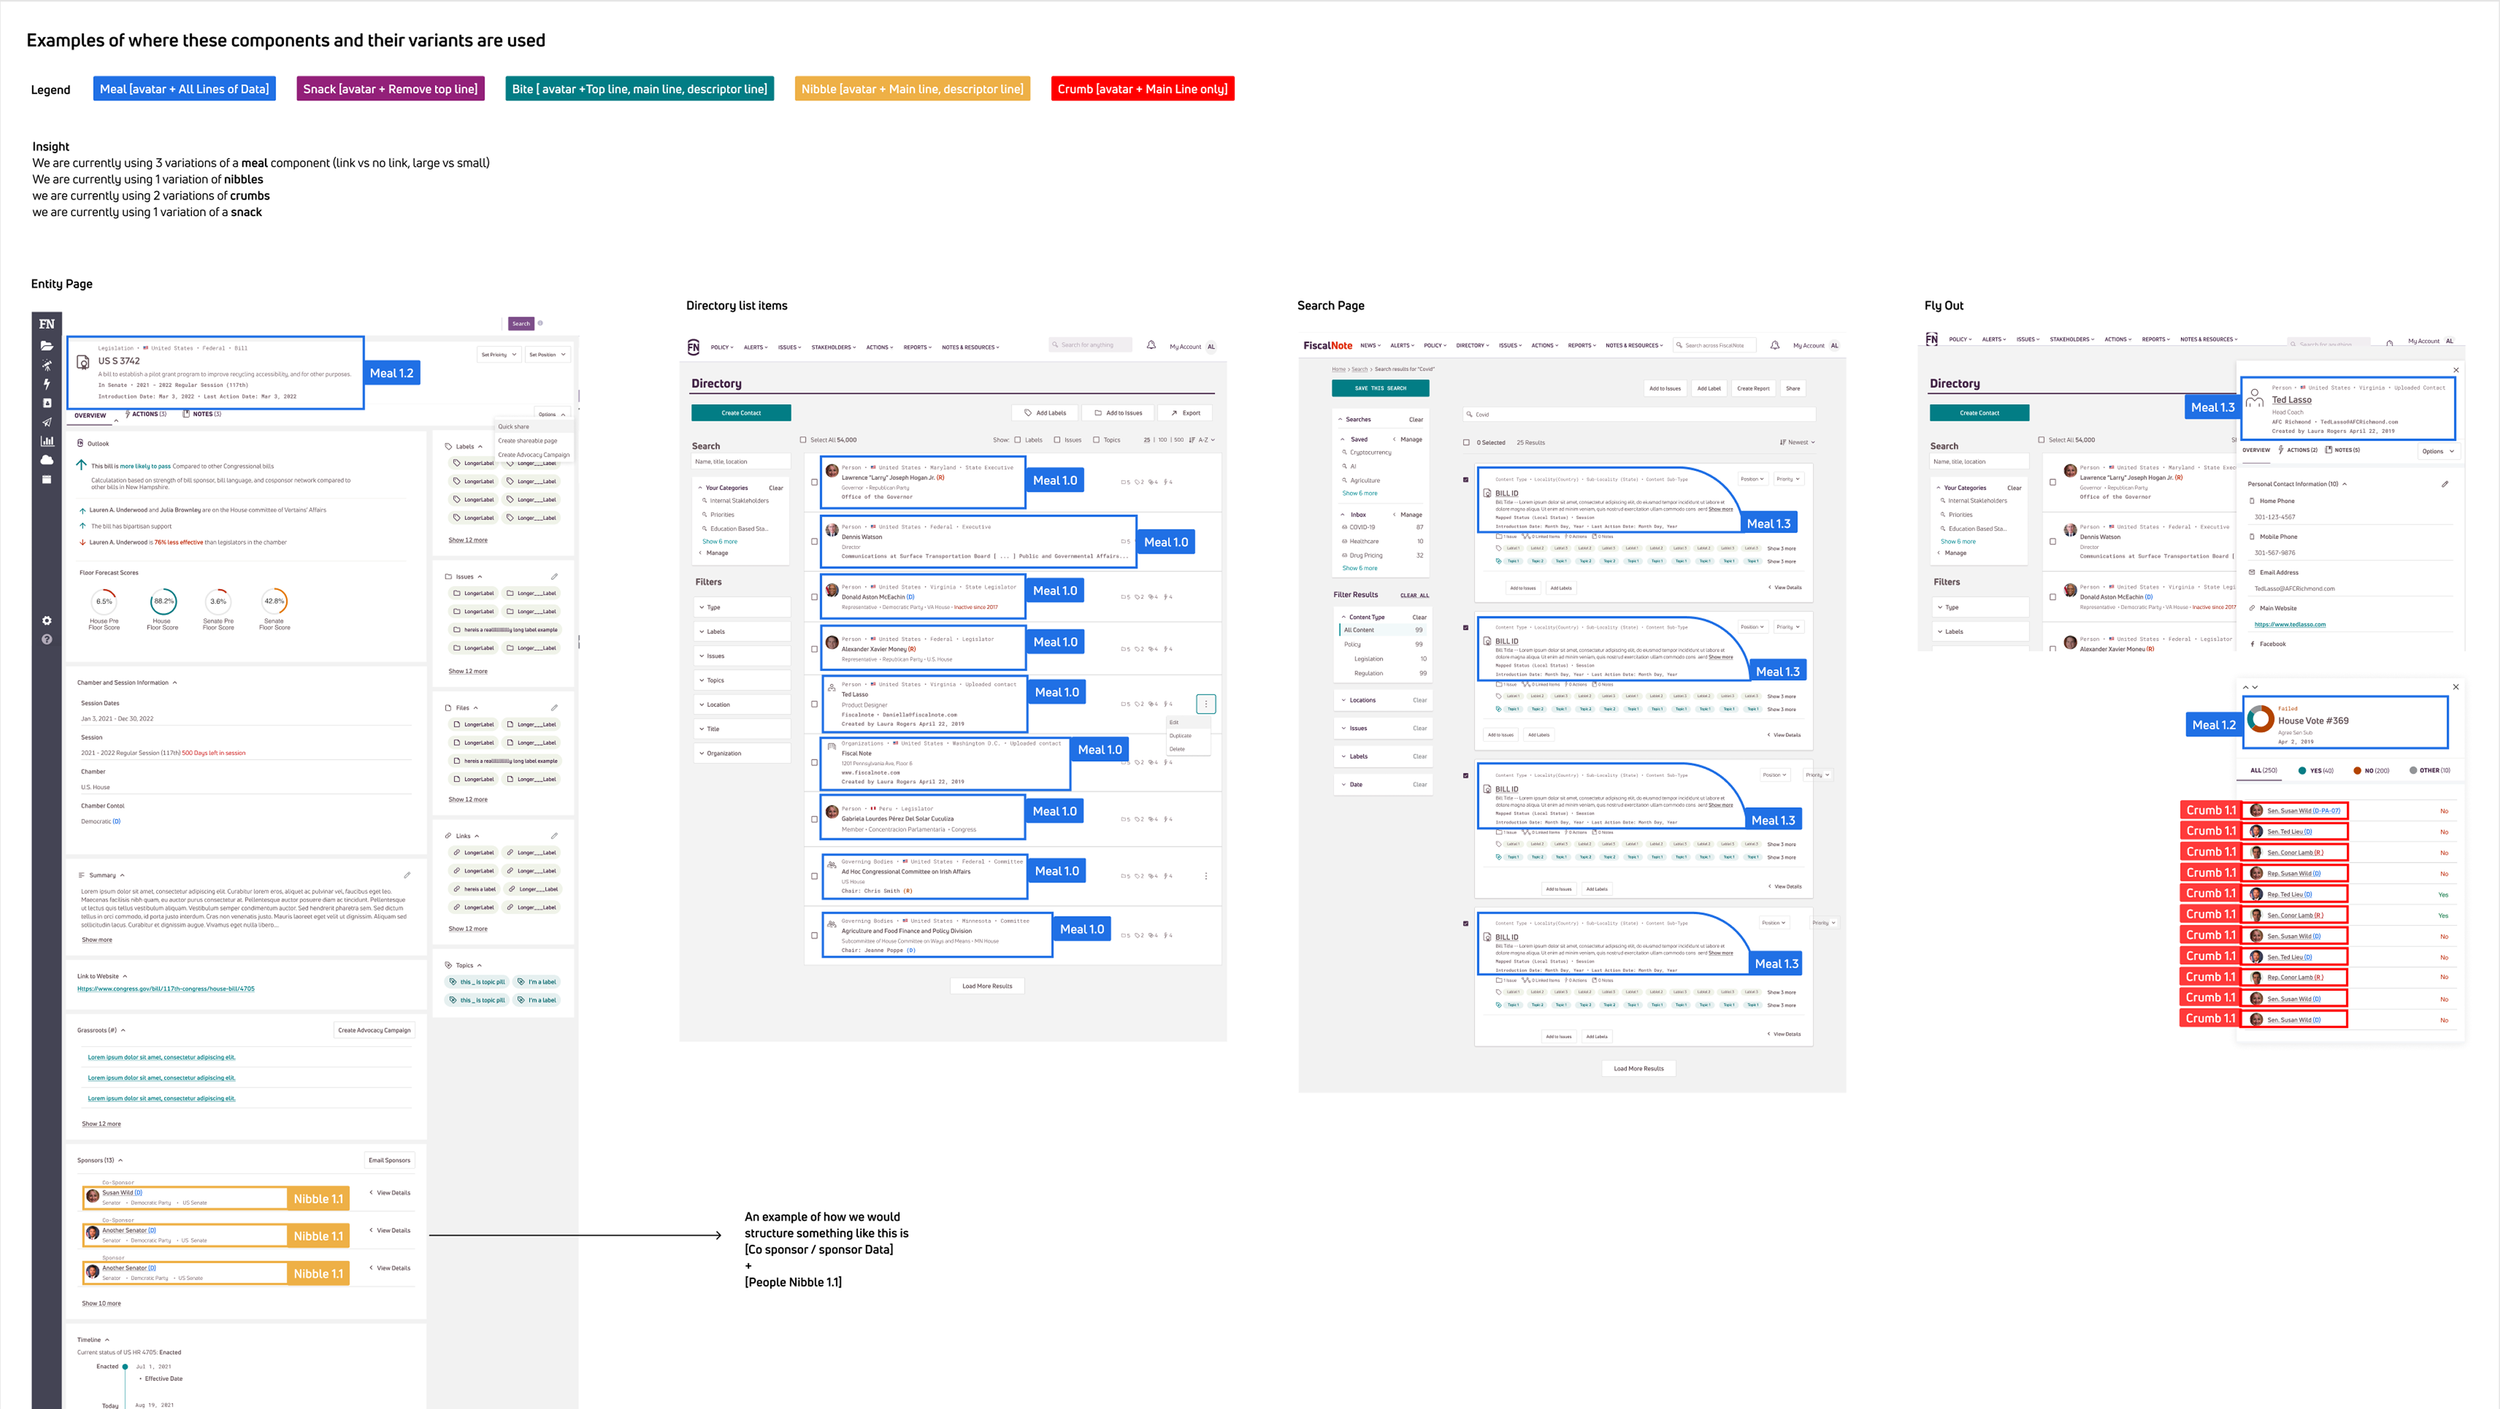
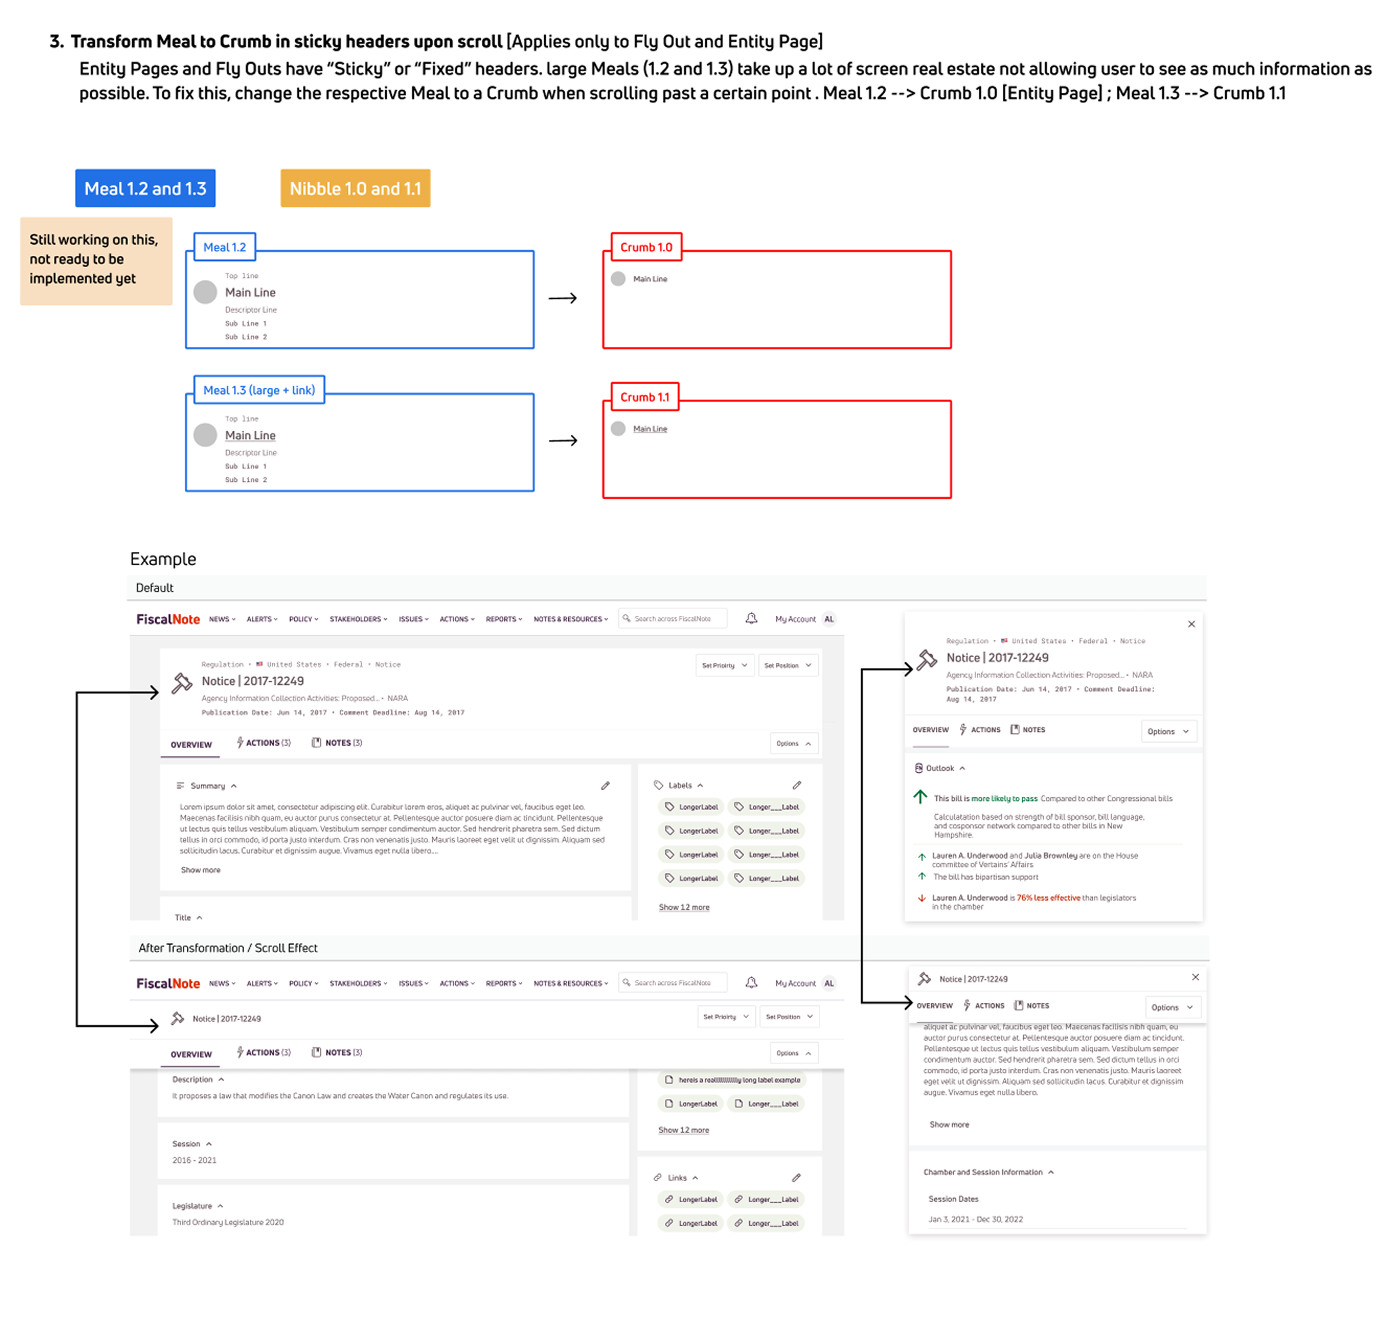
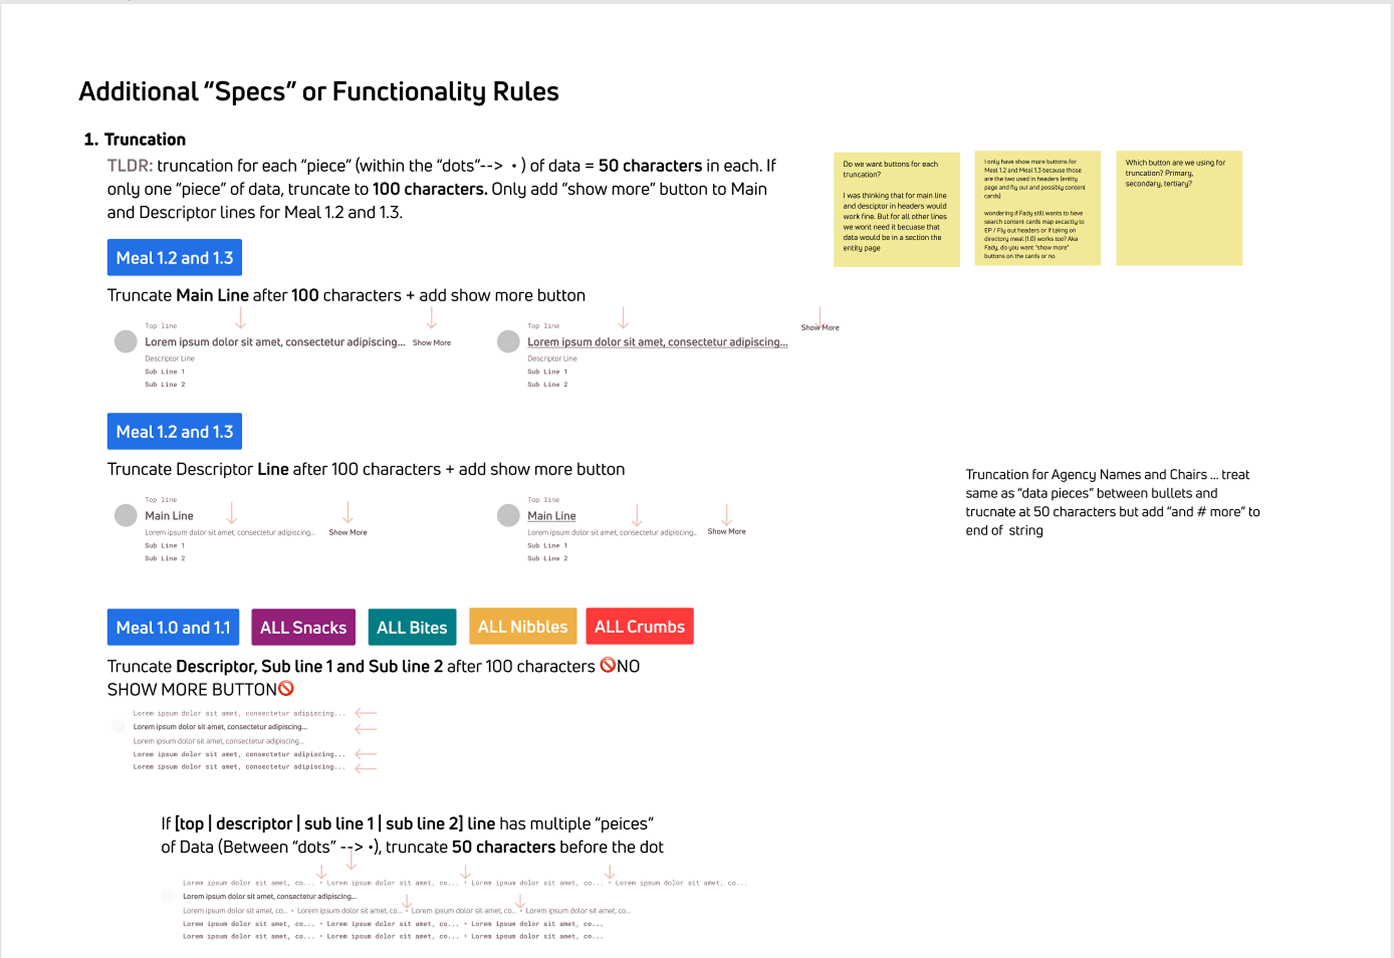
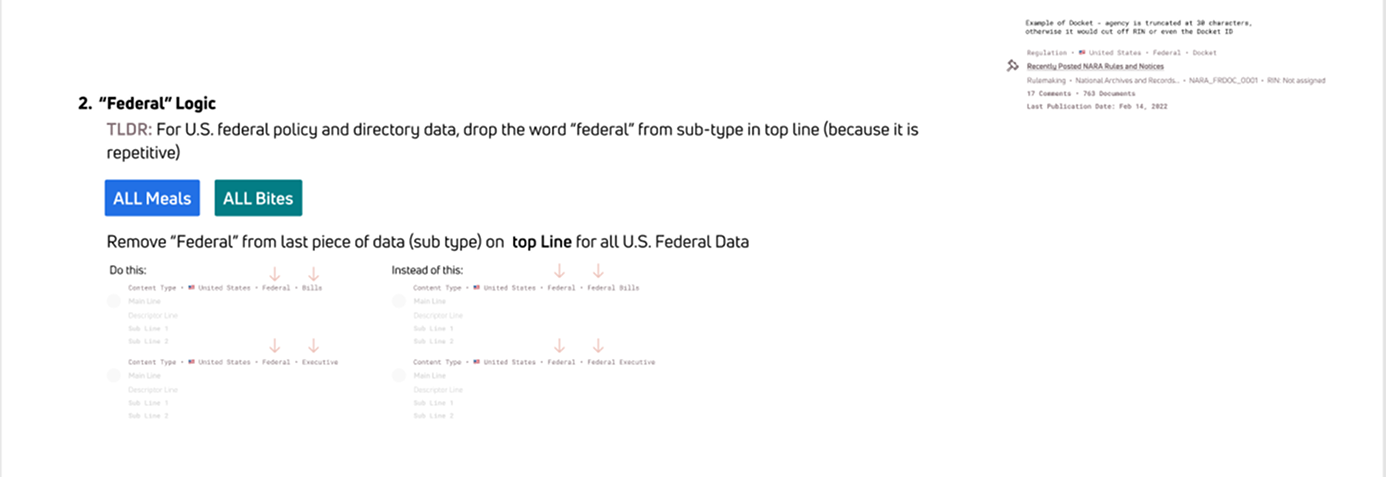
During this project, I led a major overhaul of our information architecture to create consistency and clarity across the platform. By categorizing data types and aligning them with reusable UI components, I enabled consistent data display patterns that improved skimming and comprehension.
I also established usage rules for when to apply specific visualization styles (e.g., chips, cards, tables), and documented how each mapped to backend data structures — enabling both design and engineering to build faster, smarter, and more aligned experiences.

Process
1
Research and Analysis
We conducted usability studies and stakeholder interviews with power users and new customers.
2
Design and Descope
Designed solutions for major painpoints and improved accessibility.
3
Receive Feedback and Design
Tested prototypes and created intuitive design flows with clear visual hierarchy based off feedback from key stakeholders.
4
Implementation
Iterative rollout with user feedback integration, breaking down releases into phases.
Assets
Research & Analysis
We conducted usability studies and stakeholder interviews with power users and new customers. Top pain points identified:
Too many irrelevant search results
Missing filter logic for key stakeholder tags
Inability to quickly determine recent updates or engagement
Layout overwhelmed new users and hindered task flow
Design and Descope
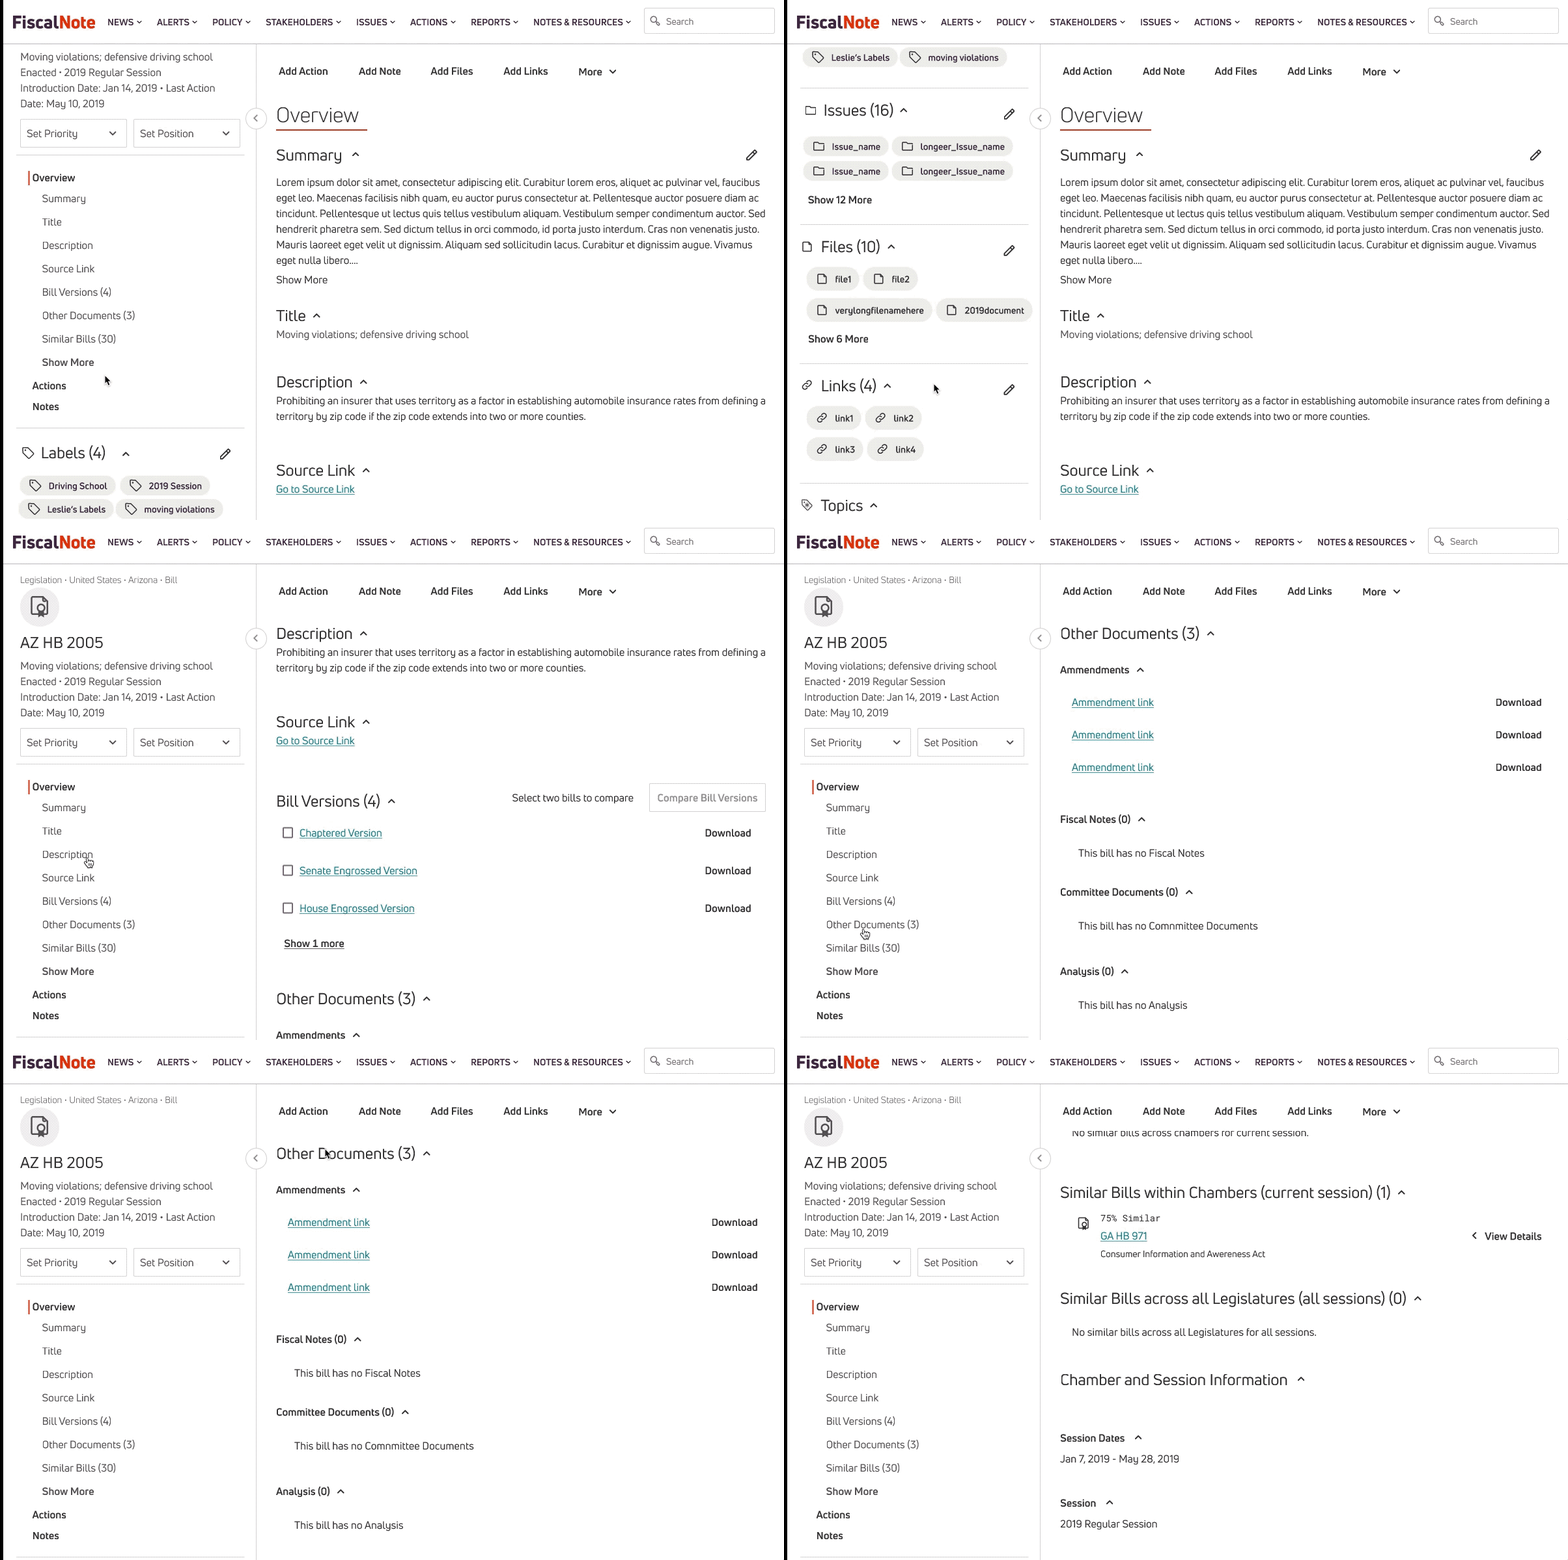
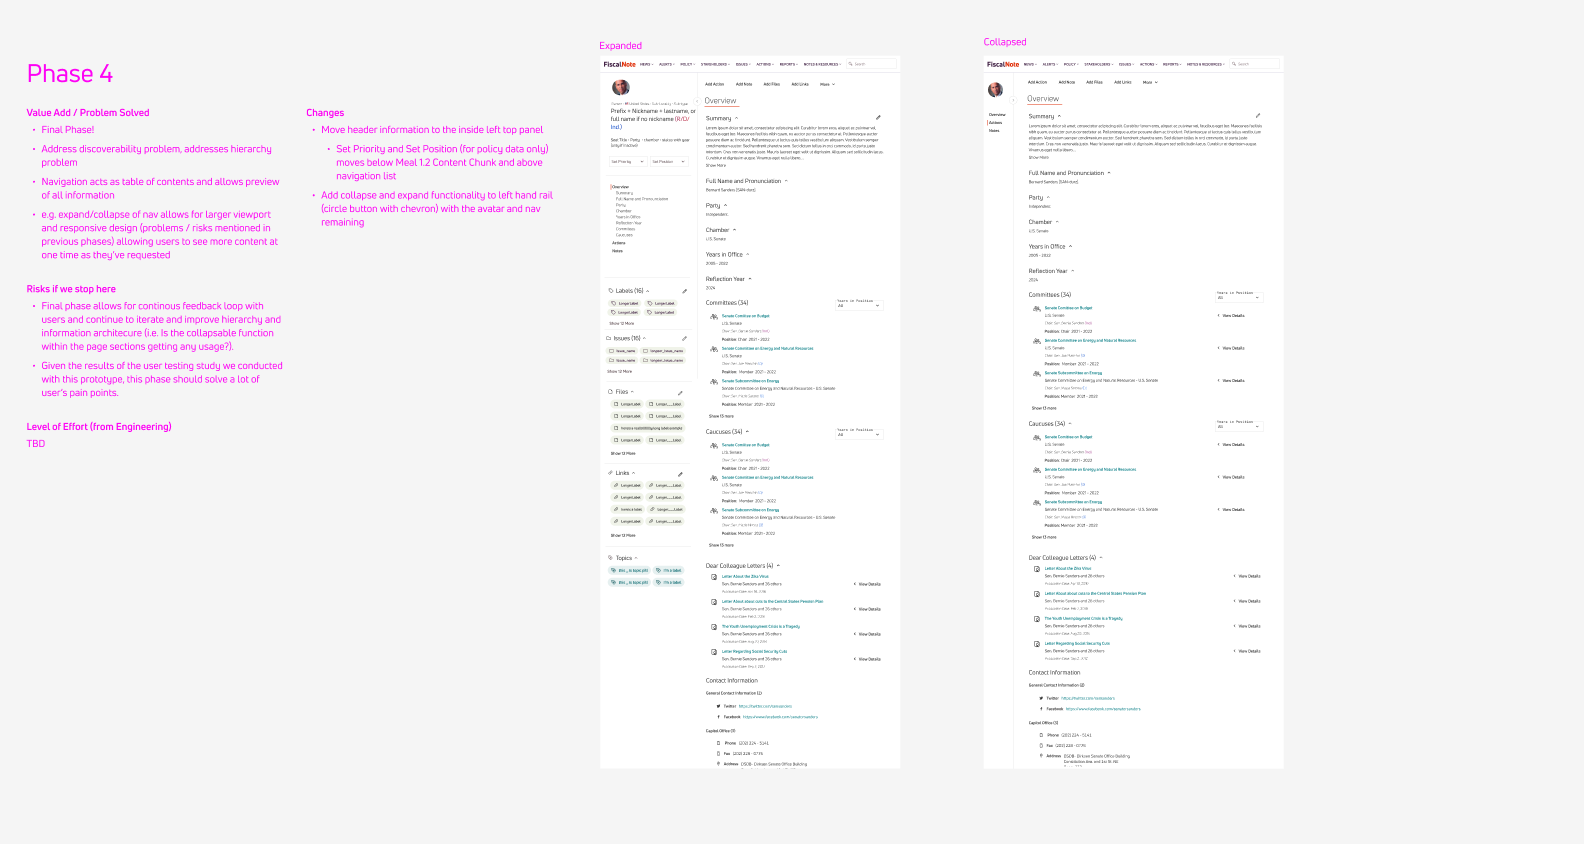
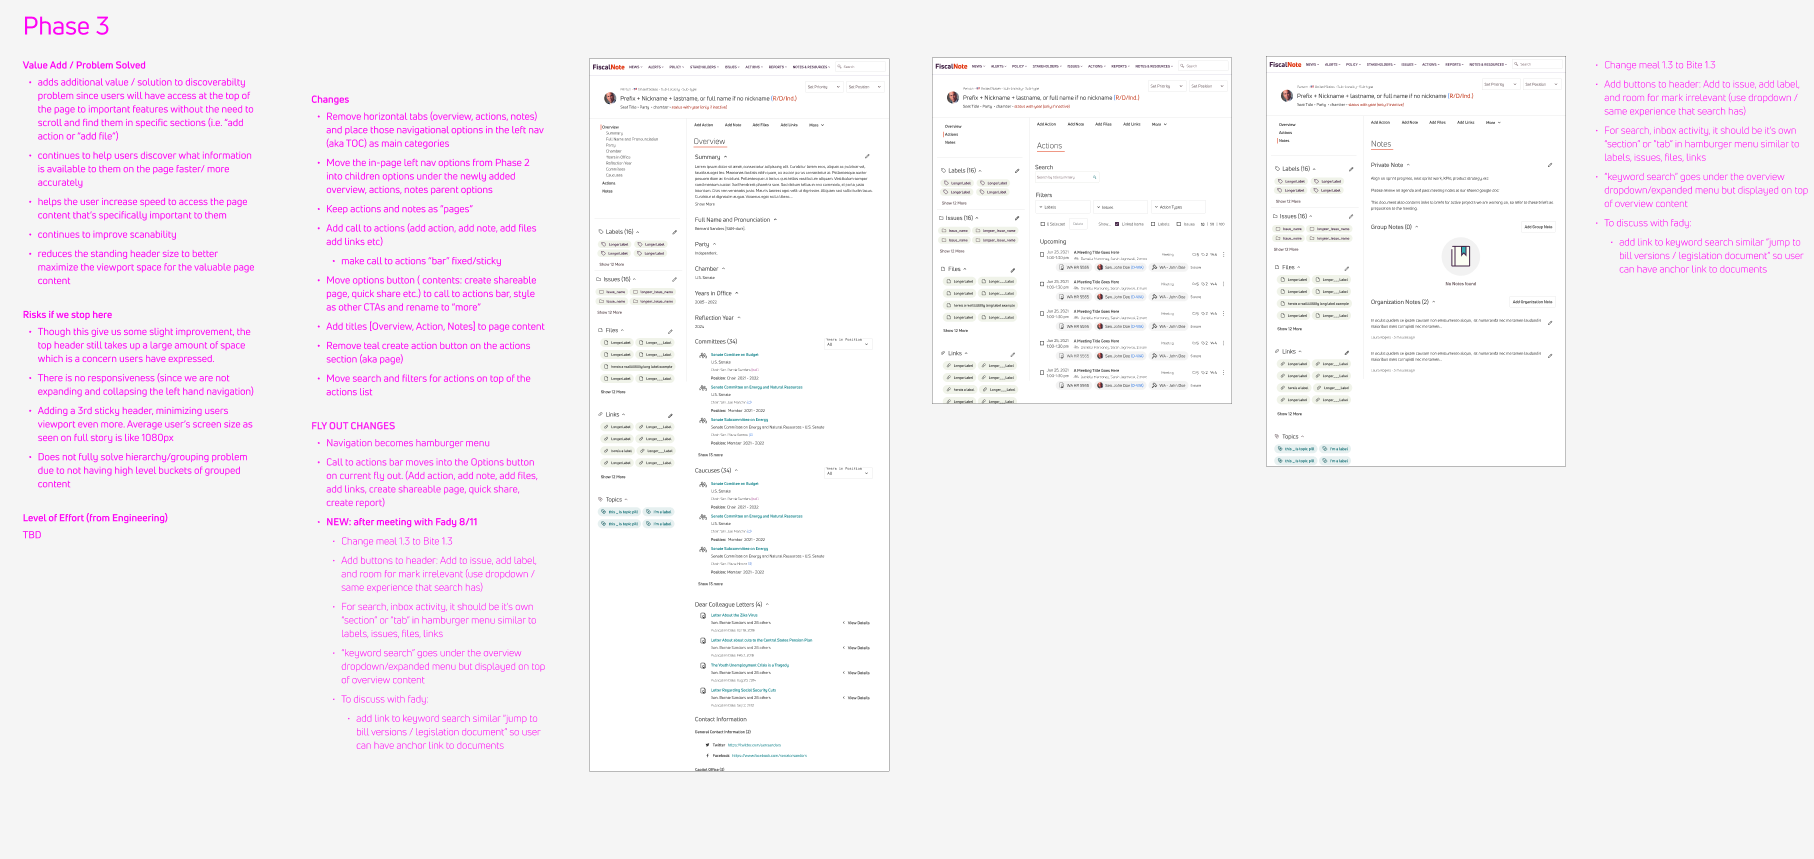
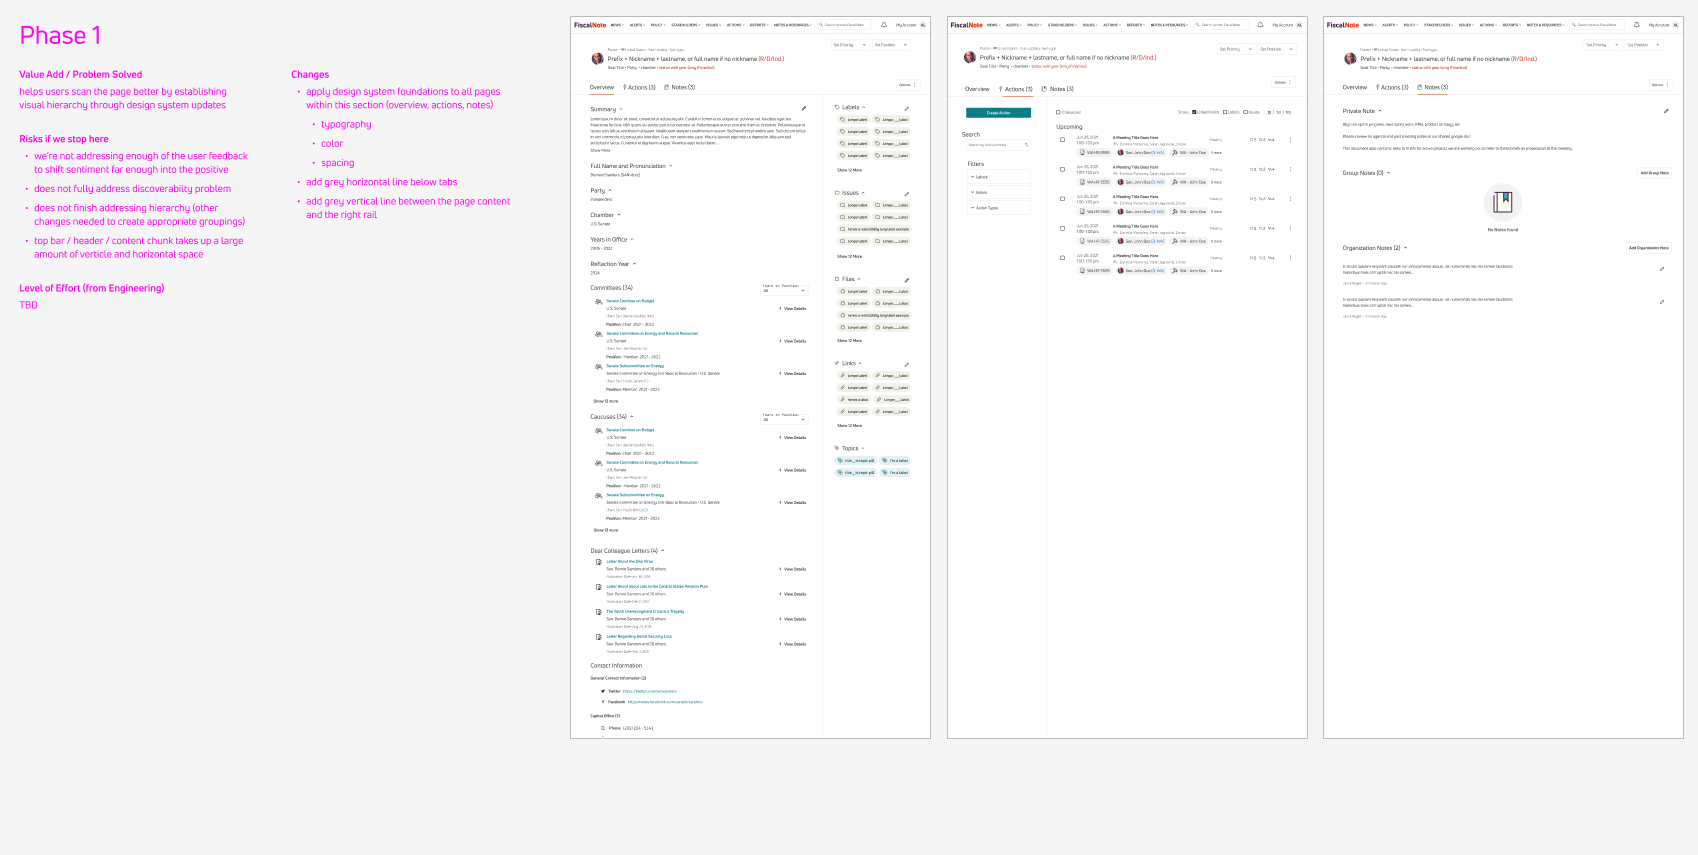
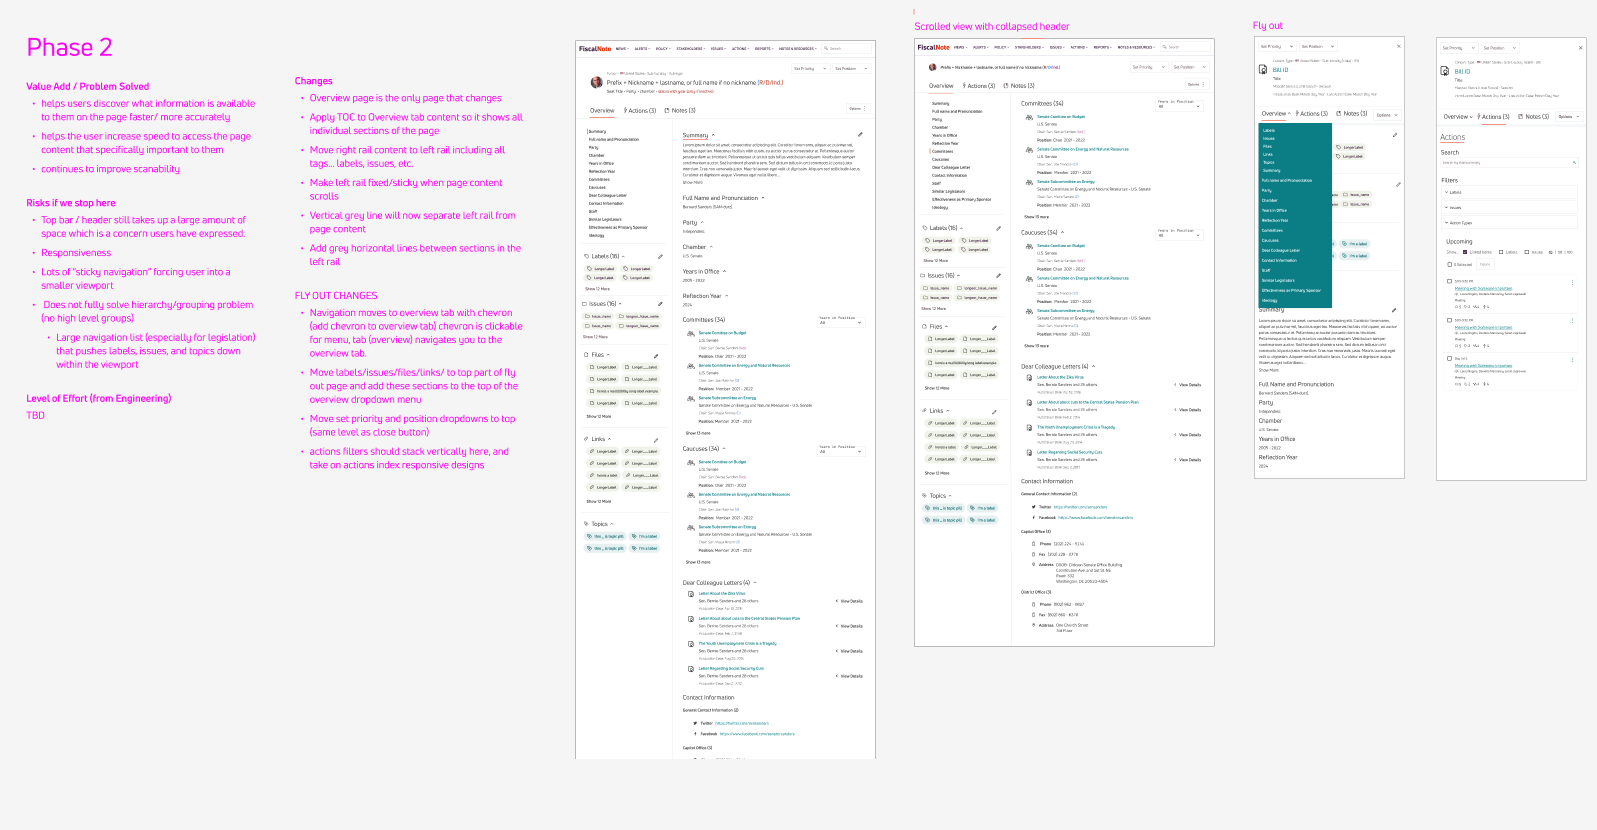
In order for redesigning the entity pages with in-page navigation to be digestible for our lead engineer to provide estimates, I broke out the designs into 4 step by step phases that could also add value to users.
Receive Feedback and Continue Designs
Phases 1-3 have been released and once phase 4 is released, the next steps are to work with Product Manager to gather feedback through moderated user studies (via Gong) and in-platform surveys (via Chameleon) and measure against our first round of feedback to see level of improvement with these new designs.
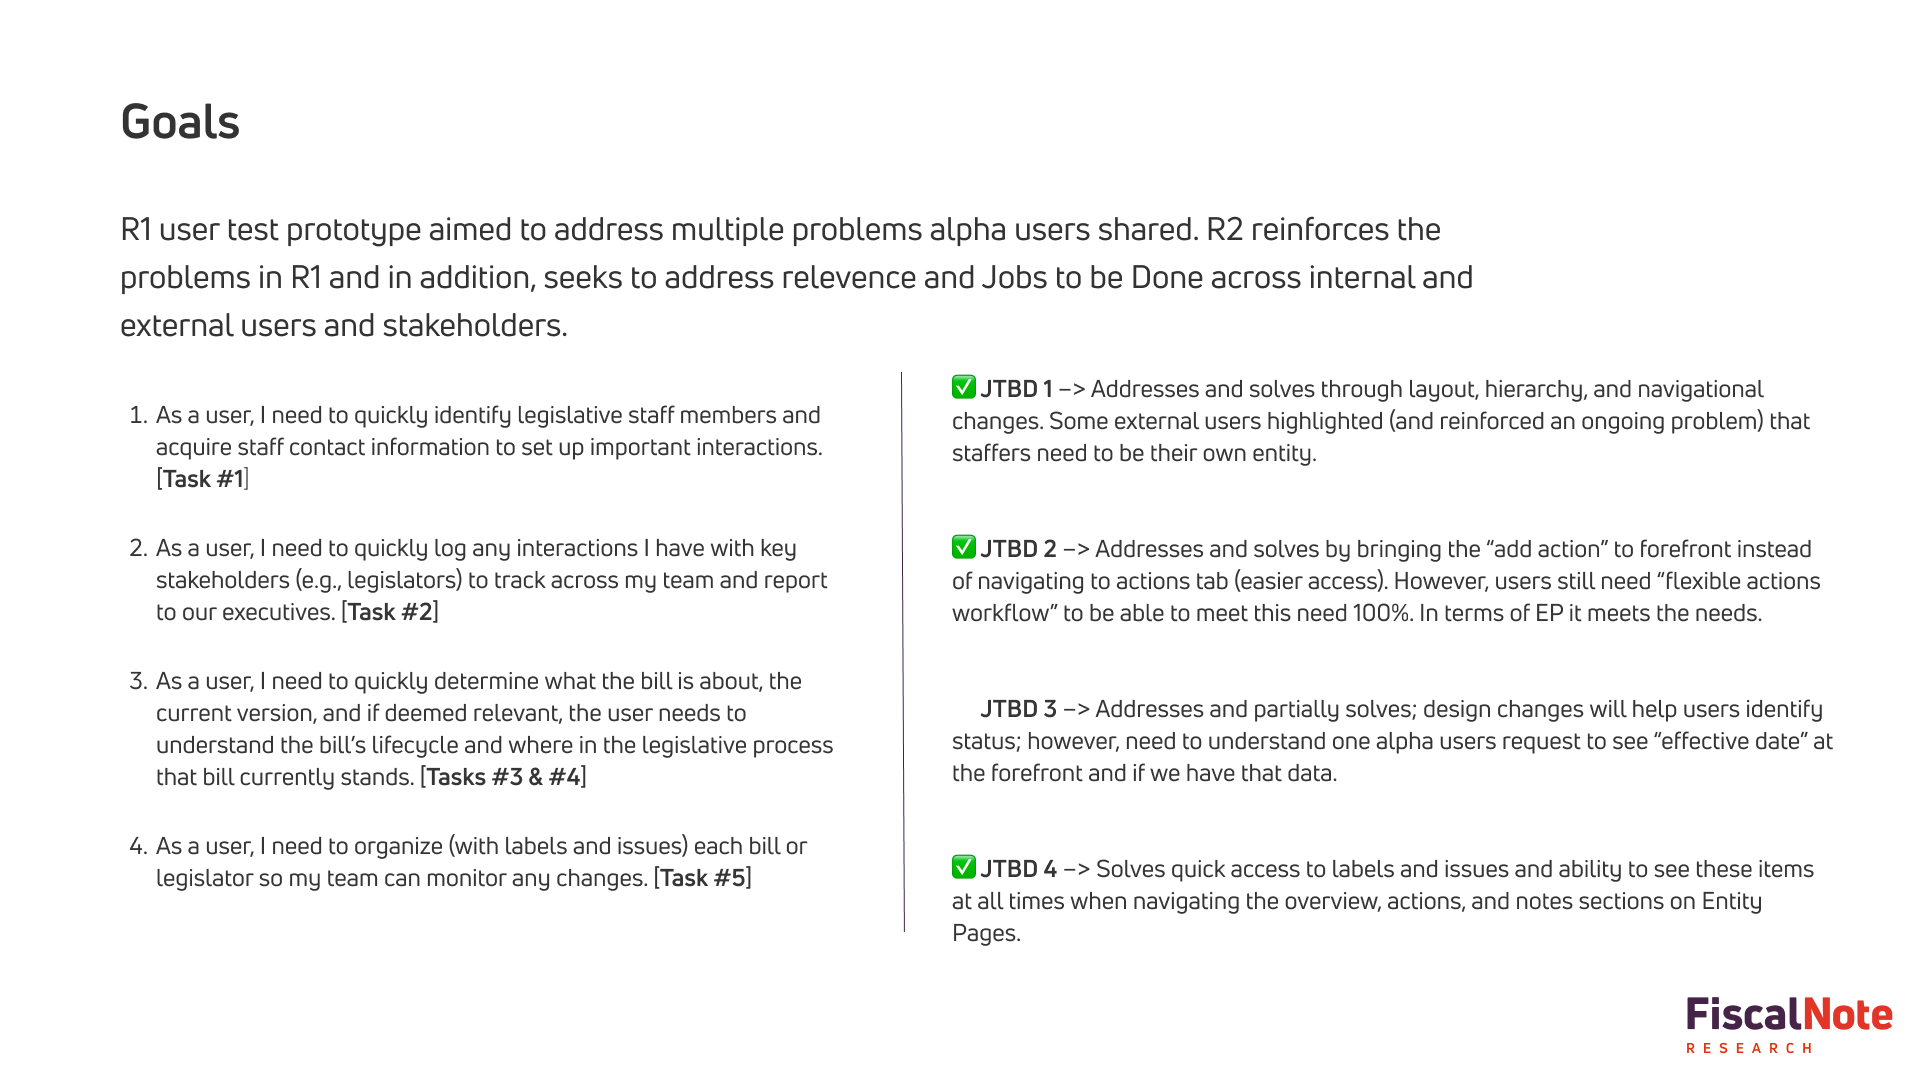
Jobs to be Done for Users
Policy users need to…
Know what is this bill / regulation / docket about? Is it relevant to my issues management team?
Know what is the status and lifecycle of this bill / regulation / docket?
Monitor and track bills / regulations / dockets etc. and if there are any changes.
Know if there are any other bills or regulations associated to bill / regulation / docket.
Organize key information to be able to find it quickly and track.
Stakeholder users need to …
Understand the stakeholder’s profile and everything about said stakeholder.
What is this stakeholder sponsoring?
Manage and track any key changes to stakeholders.
Get ahead of any risks or issues that may come if stakeholders oppose or support a bill.
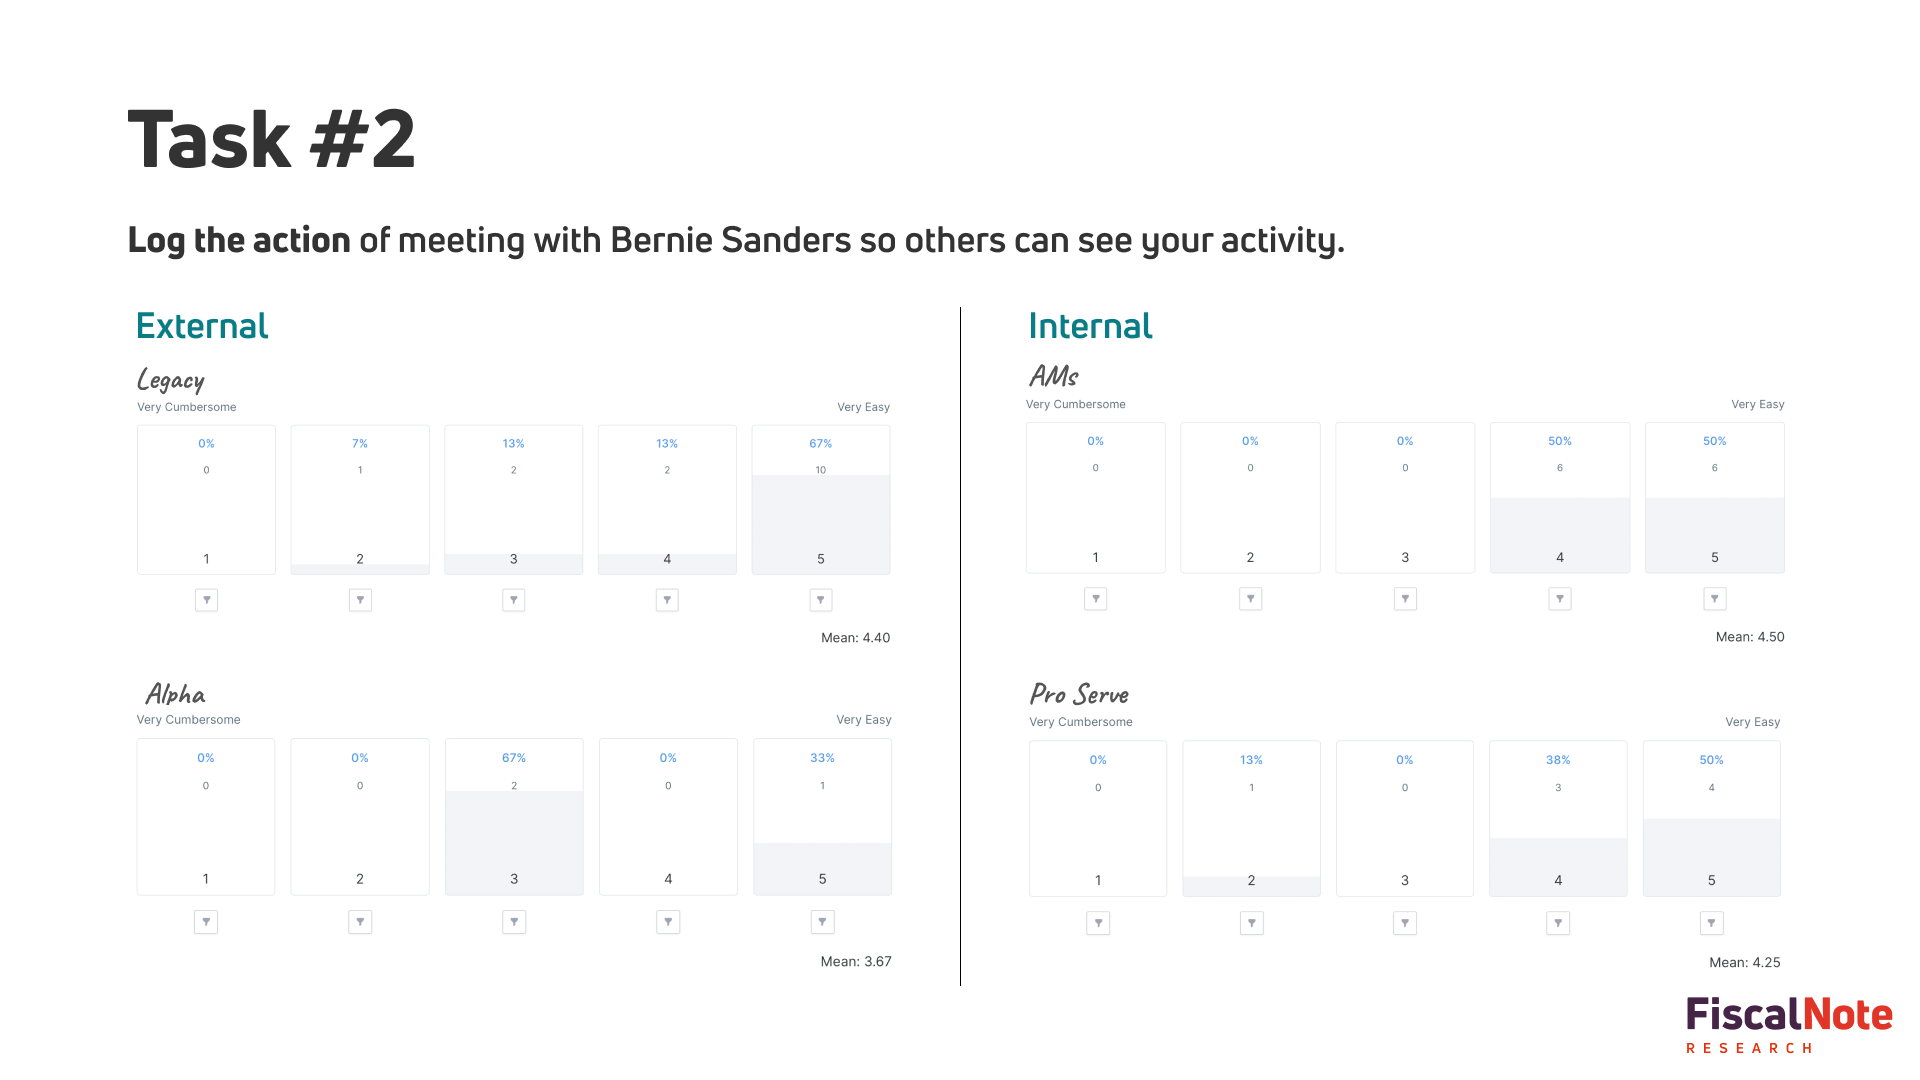
Log key interactions with stakeholders for tracking and reporting purposes.
Organize key information to be able to find it quickly and track.
Implementation and Final Design
Collaborated across PM, Eng, and CS to validate workflows
Built components into the central design system
Delivered Figma specs + engineer support for smooth dev handoff
Paired usability goals with business-level OKRs
Project Outcome & Estimated Impact
This project brought measurable usability and business improvements to a core part of the FiscalNote platform—helping policy professionals act faster, with more confidence, and ultimately stay engaged. It Directly supported two top level business goals.
Improve stakeholder management efficiency
Increase platform retention + ARR through better workflows
